

Does heating make a fixed vapor inventory less saturated?
Does heating make a fixed vapor inventory less saturated?
Section titled “Does heating make a fixed vapor inventory less saturated?”Pure vapor pressure, actual partial pressure, and saturation ratio answer different questions. This CPU example starts each gas at its pure-substance saturation concentration at 304 K, holds that mass concentration fixed, and heats it to 333 K. You will learn to interpret the resulting curves and to check a correlation’s units before using it in an aerosol model.
No particles or phase transfer are integrated. Concentrations are kg m⁻³, molar masses kg mol⁻¹, temperatures kelvin, and returned pressures pascals.
Python · section 1
# In Colab uncomment the following command to install particula:# Install from the repository root: `python -m pip install -e ".[extra]"`import matplotlib.pyplot as pltimport numpy as npimport particula as parTranslate the correlation before constructing a strategy
Section titled “Translate the correlation before constructing a strategy”Particula evaluates
| Substance | NIST A | B | C | Fit interval (K) |
|---|---|---|---|---|
| 1-butanol | 4.54607 | 1351.555 | −93.34 | 295.8–391 |
| Styrene | 4.21948 | 1525.059 | −56.379 | 303.07–417.92 |
| Water | 5.20389 | 1733.926 | −39.485 | 304–333 |
The shared 304–333 K interval stays inside these selected fits. The three construction styles below—direct, builder, factory—configure the same interface; they do not represent three different physical approximations. The printed pressures at 310 K provide a scale check. Assertions compare the converted implementation with the tabulated bar-form equations across the sweep.
Python · section 2
# Direct instantiation of an AntoineVaporPressureStrategy for butanol.# This approach directly sets the coefficients 'a', 'b', and 'c' specific# to butanol for calculating its vapor pressure.butanol_antione = par.gas.AntoineVaporPressureStrategy(    a=4.54607 + np.log10(1e5 / 133.322387415), b=1351.555, c=93.34)
# Use the Builder pattern to create a vapor pressure strategy for styrene.# The Builder pattern allows for more flexible object creation by setting properties step-by-step.# This approach, also validates the input parameters and ensures the object is fully defined.# Here, coefficients are set individually using setter methods provided by# the AntoineBuilder.styrene_coefficients = {    "a": 4.21948 + np.log10(1e5 / 133.322387415),    "b": 1525.059,    "c": 56.379,}styrene_antione = (    par.gas.AntoineVaporPressureBuilder()    .set_a(styrene_coefficients["a"])    .set_b(styrene_coefficients["b"])    .set_c(styrene_coefficients["c"])    .build())
# Initialize a vapor pressure strategy for water using the factory method.# The factory method abstracts the creation logic of the builder and can instantiate different builder strategies based on the input strategy.# This approach ensures that object creation is centralized and consistent across the application.# Note: The strategy name provided to the factory method is case-insensitive.water_coefficients = {    "a": 5.20389 + np.log10(1e5 / 133.322387415),    "b": 1733.926,    "c": 39.485,}water_antione = par.gas.VaporPressureFactory().get_strategy(    strategy_type="Antoine", parameters=water_coefficients)

# Calculate and print the vapor pressures at 310 Kelvin for each substance using the initialized strategies.# The function 'pure_vapor_pressure' is used here, which calculates the# vapor pressure based on the provided temperature.
print(    f"Butanol Antoine vapor pressure at 310 K: {butanol_antione.pure_vapor_pressure(310)} Pa")print(    f"Styrene Antoine vapor pressure at 310 K: {styrene_antione.pure_vapor_pressure(310)} Pa")print(    f"Water Antoine vapor pressure at 310 K: {water_antione.pure_vapor_pressure(310)} Pa")
Butanol Antoine vapor pressure at 310 K: 2032.0383661667272 Pa
Styrene Antoine vapor pressure at 310 K: 1608.193652926262 Pa
Water Antoine vapor pressure at 310 K: 6225.4077708165105 PaDistinguish a complete configuration from a valid correlation
Section titled “Distinguish a complete configuration from a valid correlation”The incomplete styrene builder intentionally raises an error because b and
c are missing. This catches incomplete input. It cannot establish that supplied
coefficients describe the right substance, unit convention, or temperature range.
Python · section 3
# failed build due to missing parameterstry: styrene_fail = ( par.gas.AntoineVaporPressureBuilder() .set_a(styrene_coefficients["a"]) .build() )except ValueError as e: print(e) # prints error message[ERROR|abc_builder|L150]: Required parameter(s) not set: b, cRequired parameter(s) not set: b, cCompare saturation reference pressures
Section titled “Compare saturation reference pressures”The first figure evaluates the selected fits from 304 to 333 K. Its logarithmic ordinate makes relative differences visible. These are pure-substance equilibrium pressures, not the pressure contributed by the actual gas inventory. Check both the trend with temperature and the pressure scale before using a fit downstream.
Python · section 4
# Stay within the intersection of the selected NIST fit intervals.temperatures = np.linspace(304.0, 333.0, 100)
# Calculate the vapor pressures for each substance at the range of temperatures.butanol_vapor_pressure = butanol_antione.pure_vapor_pressure(temperatures)styrene_vapor_pressure = styrene_antione.pure_vapor_pressure(temperatures)water_vapor_pressure = water_antione.pure_vapor_pressure(temperatures)
# Independent tabulated convention: bar and T + C, converted directly to Pa.for strategy, (a_bar, b_kelvin, c_kelvin) in [    (butanol_antione, (4.54607, 1351.555, -93.34)),    (styrene_antione, (4.21948, 1525.059, -56.379)),    (water_antione, (5.20389, 1733.926, -39.485)),]:    reference_pa = 1e5 * 10 ** (a_bar - b_kelvin / (temperatures + c_kelvin))    np.testing.assert_allclose(        strategy.pure_vapor_pressure(temperatures), reference_pa, rtol=1e-12    )

# Plot the vapor pressures for each substance.fig, ax = plt.subplots(figsize=(8, 6))ax.plot(temperatures, butanol_vapor_pressure, label="Butanol")ax.plot(temperatures, styrene_vapor_pressure, label="Styrene", linestyle="--")ax.plot(temperatures, water_vapor_pressure, label="Water", linestyle="-.")ax.set_yscale("log")ax.set_xlabel("Temperature (K)")ax.set_ylabel("Pure Vapor Pressure (Pa)")ax.set_title("Pure Vapor Pressure vs Temperature")ax.legend()plt.show()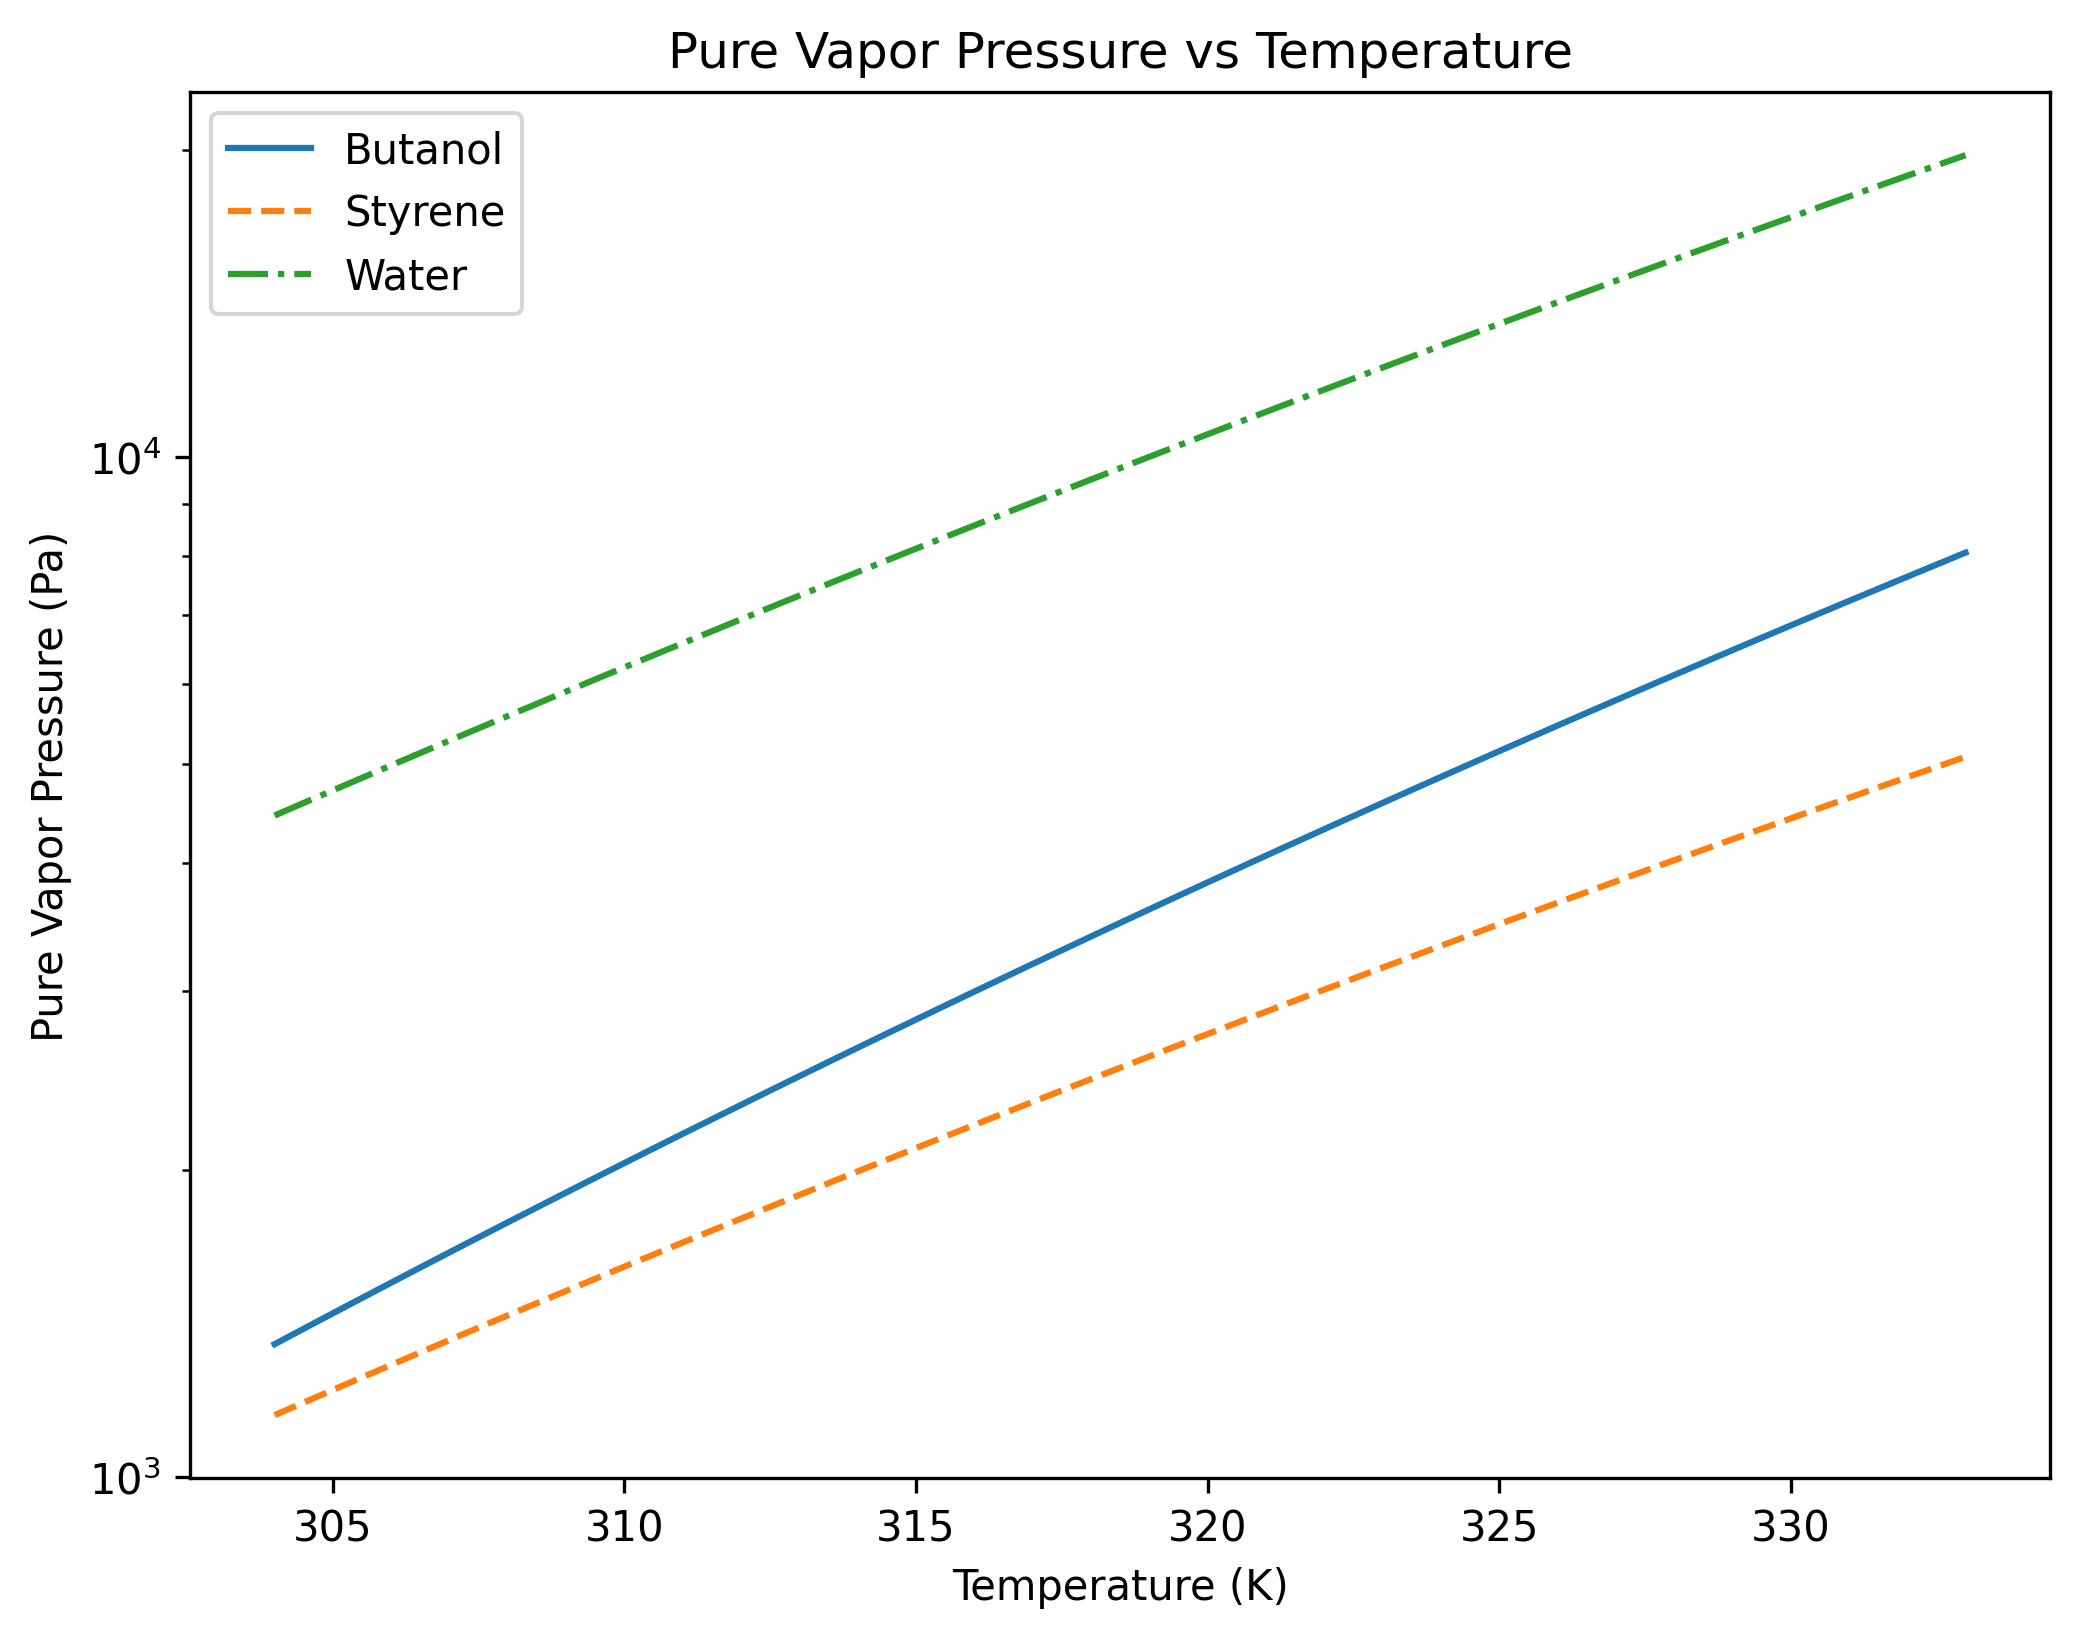
Express the reference as a mass concentration
Section titled “Express the reference as a mass concentration”The ideal-gas conversion is
Saturation concentration is an equilibrium reference, not a hard upper bound: a supersaturated vapor may temporarily exceed it. Nor is it a liquid solubility measurement. The strategy shares this conversion across property models.
Python · section 5
# Define the molar mass of each substance in kg/molbutanol_molar_mass = 74.12e-3styrene_molar_mass = 104.15e-3water_molar_mass = 18.015e-3
# calculate the concentration pressure vs temperaturebutanol_saturation_concentration = butanol_antione.saturation_concentration(    molar_mass=butanol_molar_mass, temperature=temperatures)styrene_saturation_concentration = styrene_antione.saturation_concentration(    molar_mass=styrene_molar_mass, temperature=temperatures)water_saturation_concentration = water_antione.saturation_concentration(    molar_mass=water_molar_mass, temperature=temperatures)
# Plot the saturation concentrations for each substance.fig, ax = plt.subplots(figsize=(8, 6))ax.plot(temperatures, butanol_saturation_concentration, label="Butanol")ax.plot(    temperatures,    styrene_saturation_concentration,    label="Styrene",    linestyle="--",)ax.plot(    temperatures, water_saturation_concentration, label="Water", linestyle="-.")ax.set_yscale("log")ax.set_xlabel("Temperature (K)")ax.set_ylabel("Saturation Concentration (kg/m^3)")ax.set_title("Saturation Concentration vs Temperature")ax.legend()plt.show()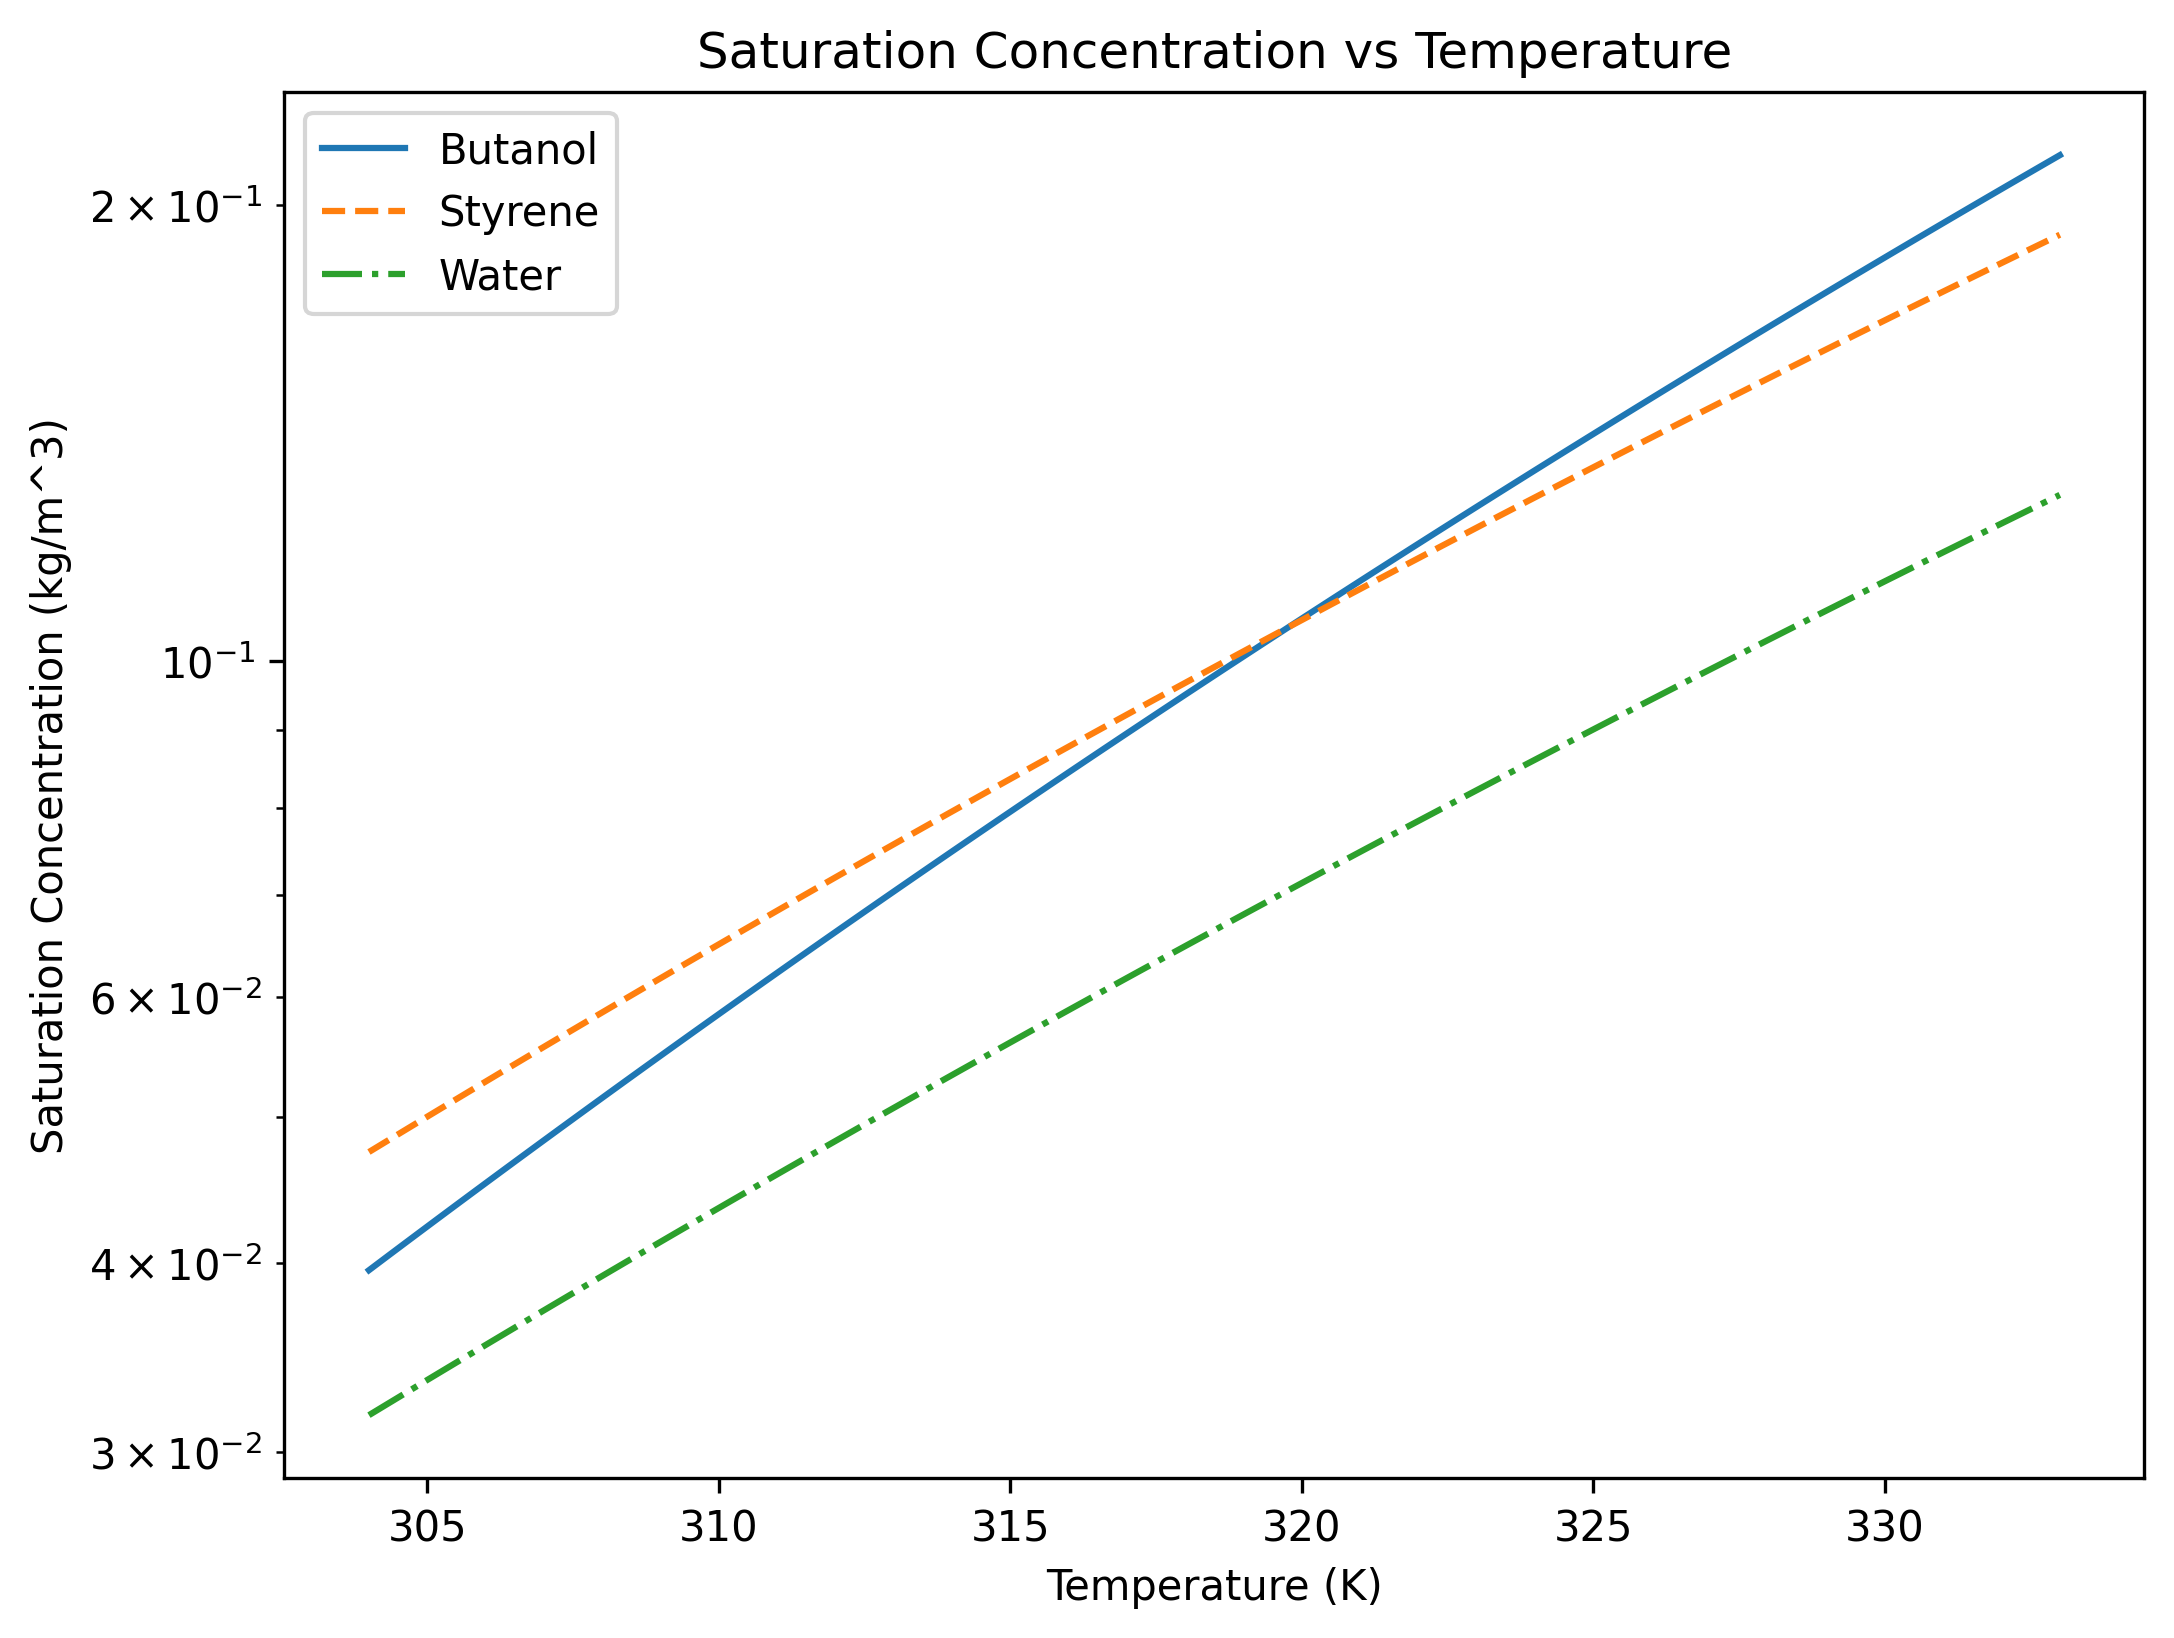
Hold mass concentration fixed while changing temperature
Section titled “Hold mass concentration fixed while changing temperature”Now take each gas’s saturation concentration at 304 K and keep it fixed.
Its actual partial pressure follows
No expanding parcel is modeled: changing volume or exchanging mass would also
change concentration. The method used below is partial_pressure.
Python · section 6
# saturation concentration at 304 Kbutanol_304K_concentration = butanol_saturation_concentration[0]styrene_304K_concentration = styrene_saturation_concentration[0]water_304K_concentration = water_saturation_concentration[0]
# caculate the partial pressure of each substance at 304 Kbutanol_partial_pressure = butanol_antione.partial_pressure(    concentration=butanol_304K_concentration,    molar_mass=butanol_molar_mass,    temperature=temperatures,)styrene_partial_pressure = styrene_antione.partial_pressure(    concentration=styrene_304K_concentration,    molar_mass=styrene_molar_mass,    temperature=temperatures,)water_partial_pressure = water_antione.partial_pressure(    concentration=water_304K_concentration,    molar_mass=water_molar_mass,    temperature=temperatures,)
# Plot the partial pressures for each substance.fig, ax = plt.subplots(figsize=(8, 6))ax.plot(temperatures, butanol_partial_pressure, label="Butanol")ax.plot(temperatures, styrene_partial_pressure, label="Styrene", linestyle="--")ax.plot(temperatures, water_partial_pressure, label="Water", linestyle="-.")ax.set_yscale("log")ax.set_xlabel("Temperature (K)")ax.set_ylabel("Partial Pressure (Pa)")ax.set_title("Partial Pressure vs Temperature")ax.legend()plt.show()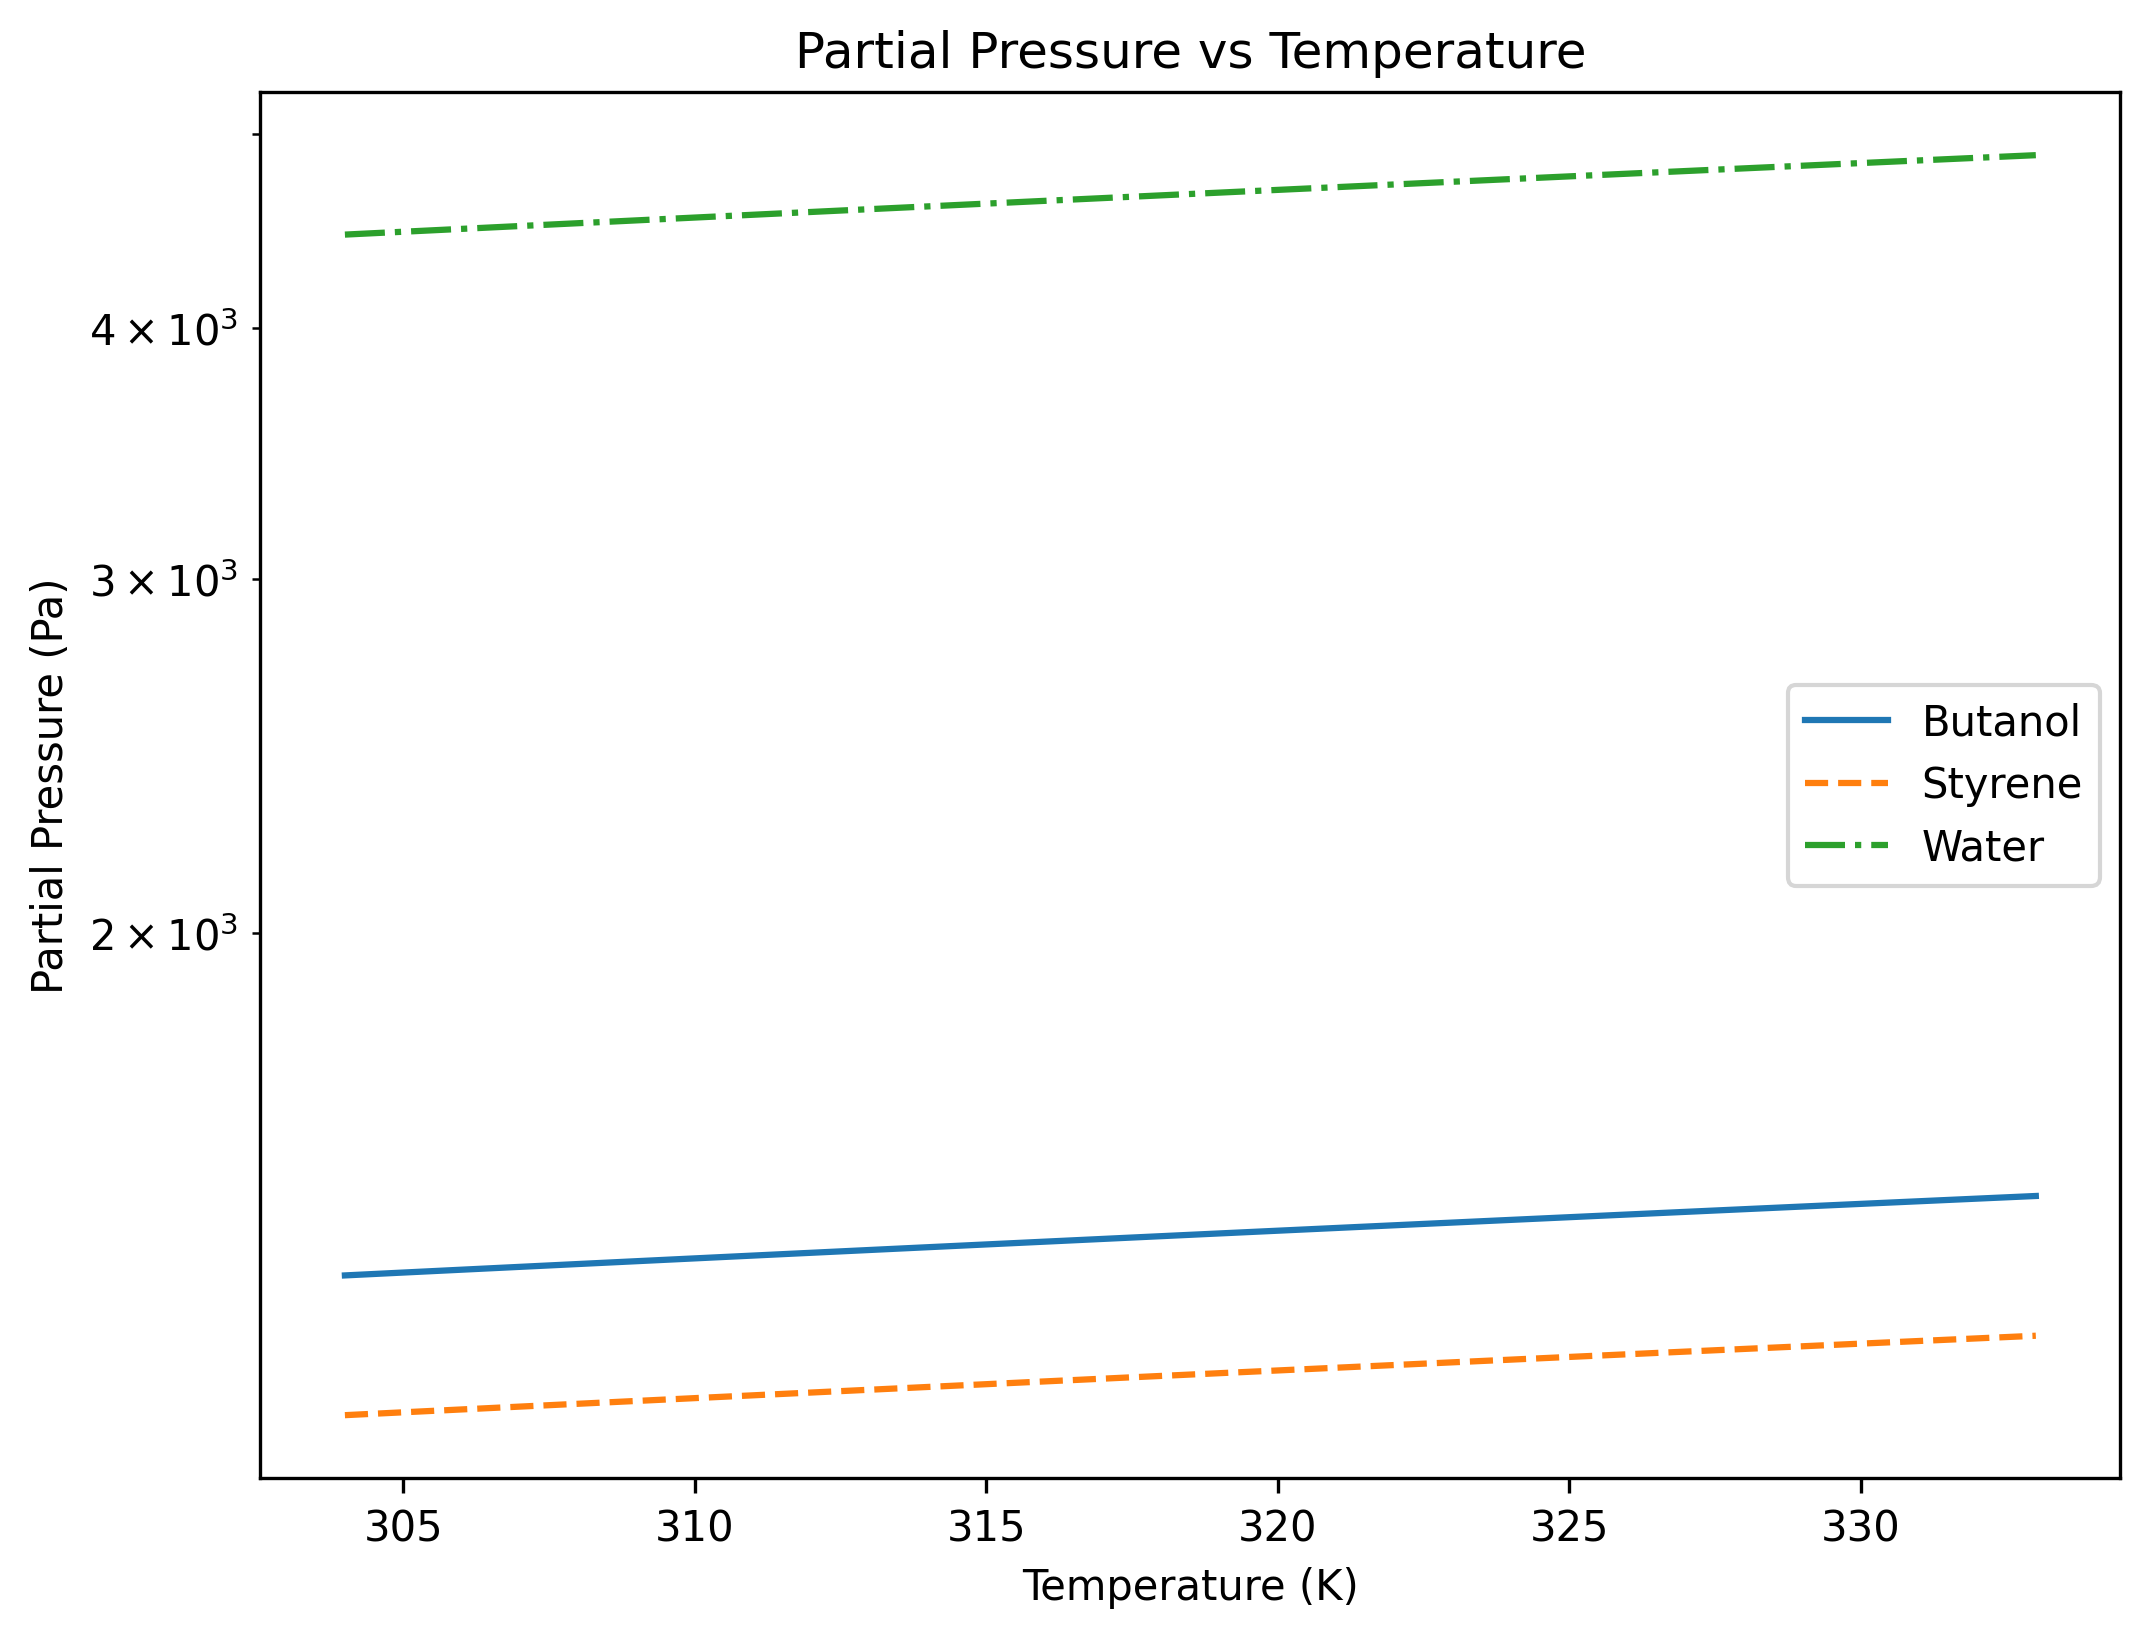
Compare actual pressure with the moving reference
Section titled “Compare actual pressure with the moving reference”The dimensionless saturation ratio is
As temperature rises over this interval, inspect how the saturation reference changes relative to the fixed-inventory partial pressure. A value below one means undersaturation relative to the pure phase. Curvature and solution activity must be included before predicting the sign of transfer to a real particle. The plot does not calculate an evaporation rate.
Python · section 7
# caculate the saturation ratiobutanol_saturation_ratio = butanol_antione.saturation_ratio(    concentration=butanol_304K_concentration,    molar_mass=butanol_molar_mass,    temperature=temperatures,)styrene_saturation_ratio = styrene_antione.saturation_ratio(    concentration=styrene_304K_concentration,    molar_mass=styrene_molar_mass,    temperature=temperatures,)water_saturation_ratio = water_antione.saturation_ratio(    concentration=water_304K_concentration,    molar_mass=water_molar_mass,    temperature=temperatures,)
# Plot the saturation ratios for each substance.fig, ax = plt.subplots(figsize=(8, 6))ax.plot(temperatures, butanol_saturation_ratio, label="Butanol")ax.plot(temperatures, styrene_saturation_ratio, label="Styrene", linestyle="--")ax.plot(temperatures, water_saturation_ratio, label="Water", linestyle="-.")ax.set_xlabel("Temperature (K)")ax.set_ylabel("Saturation Ratio")ax.set_title("Saturation Ratio vs Temperature")ax.legend()plt.show()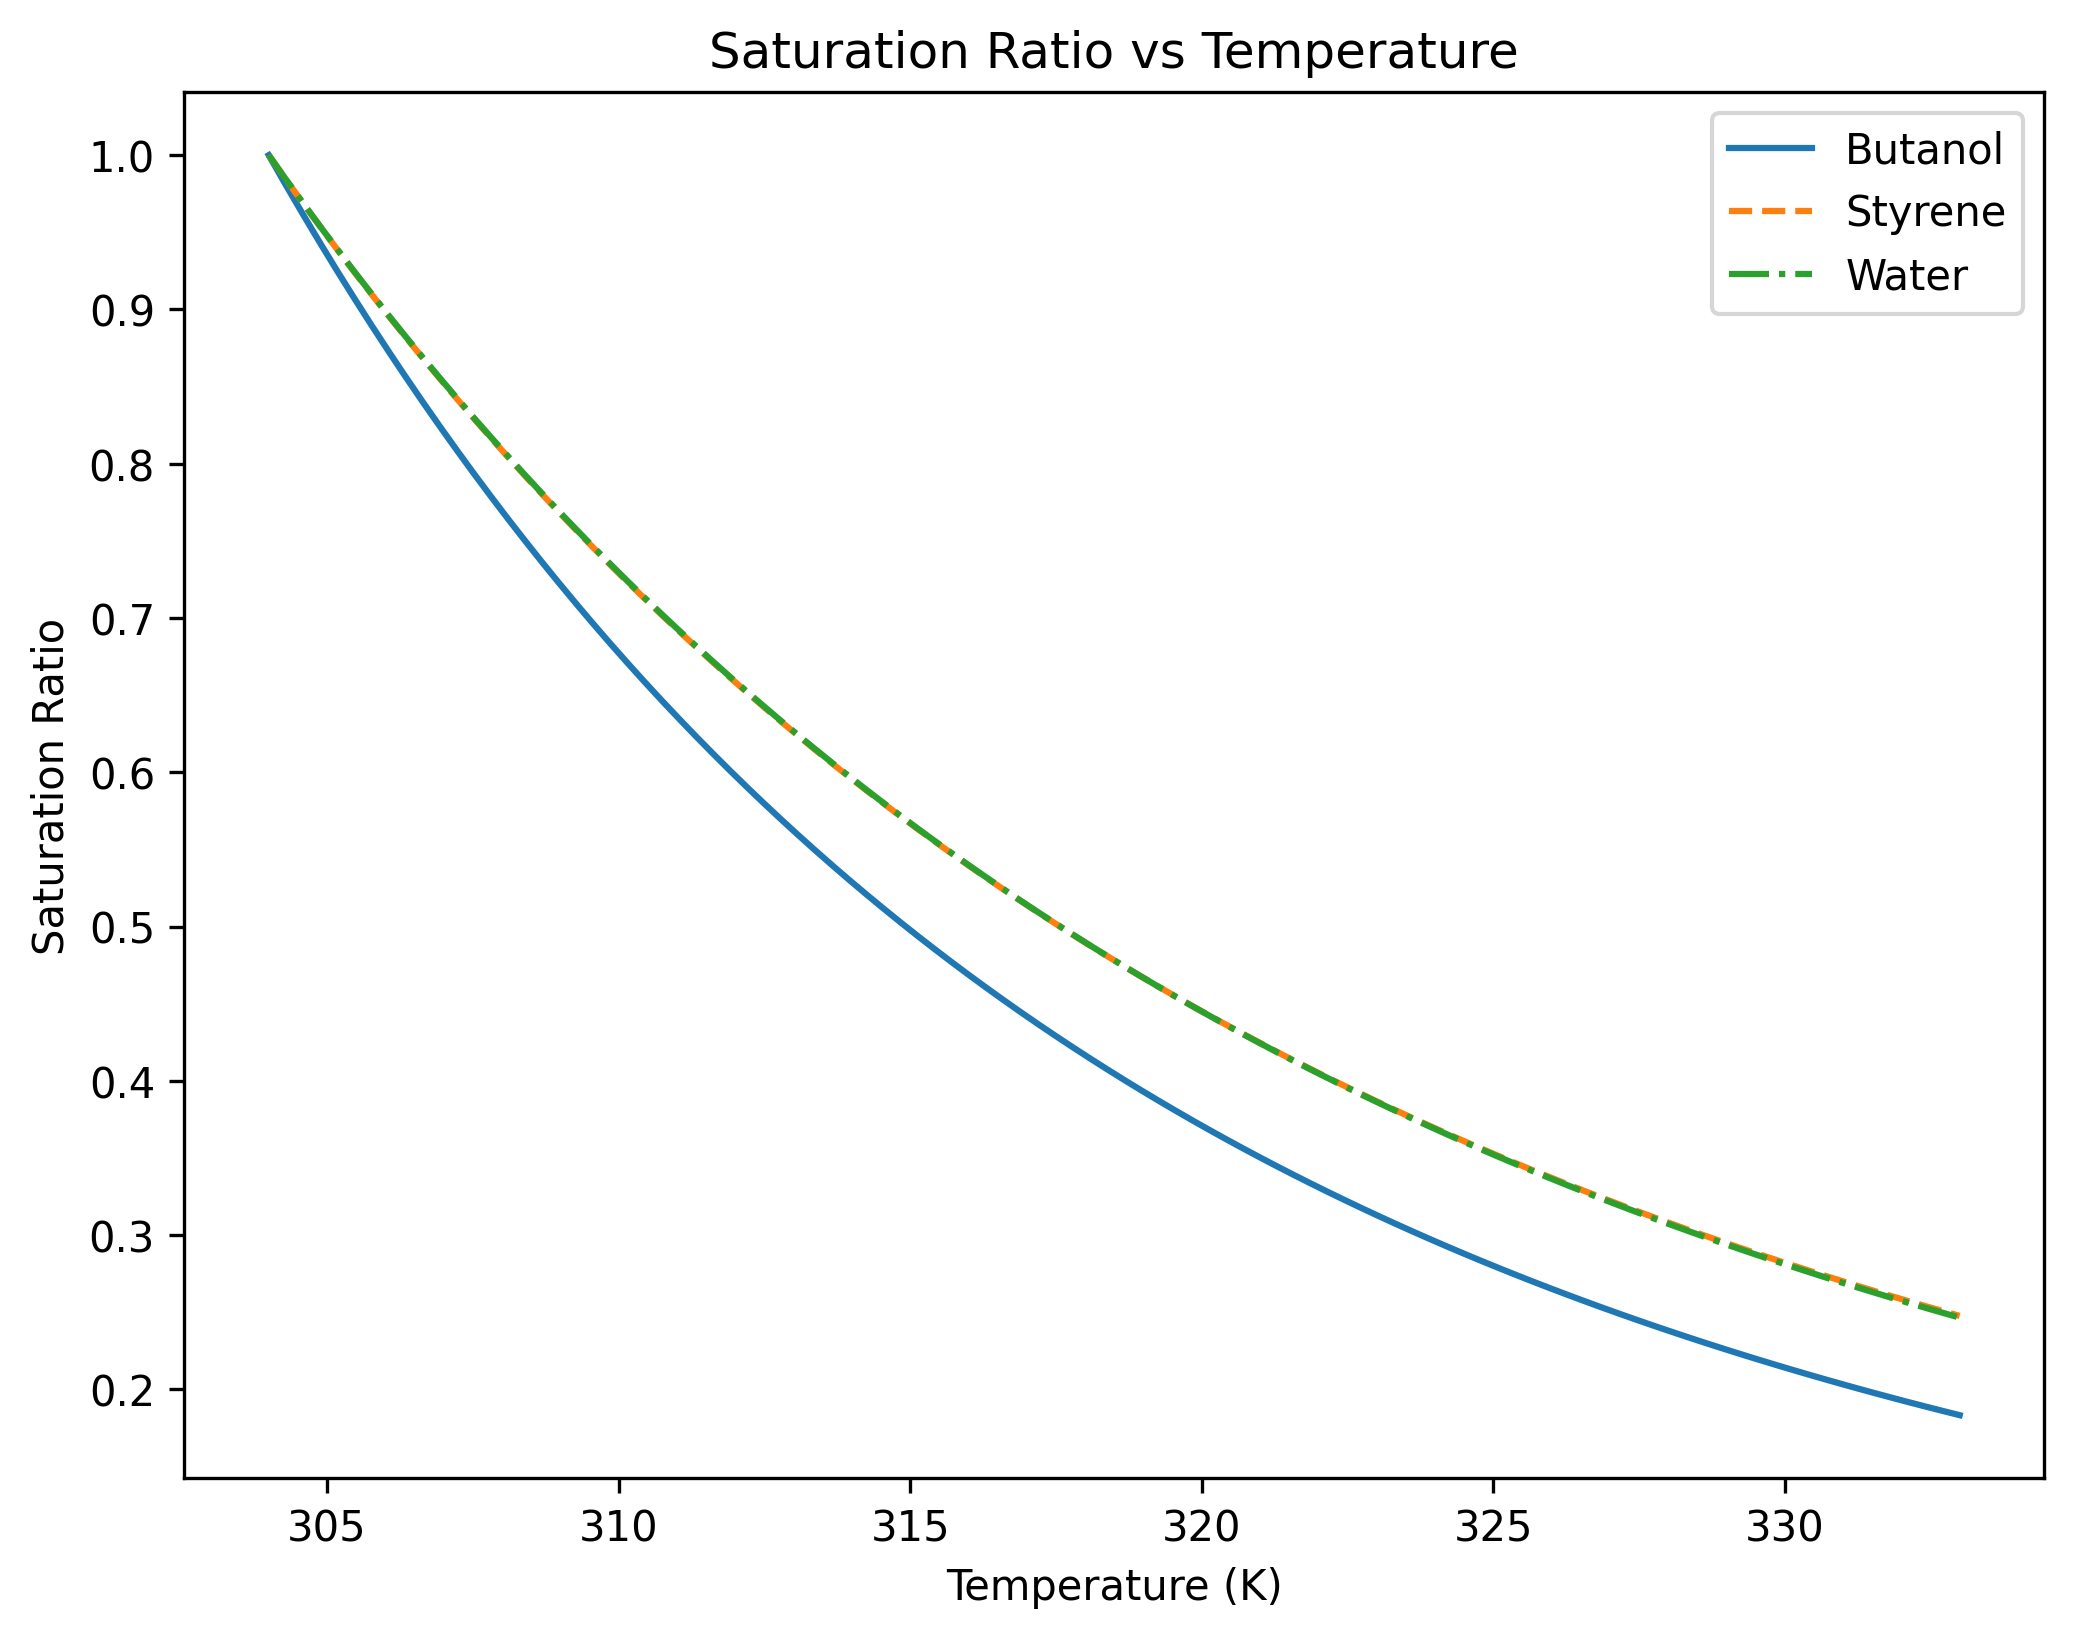
Compare approximations with a shared reference point
Section titled “Compare approximations with a shared reference point”The final figure compares four water models over the same 304–333 K interval. The constant and Clausius–Clapeyron models are anchored to the Antoine pressure at 310 K. The constant model removes temperature dependence deliberately; Clausius–Clapeyron uses a fixed molar latent heat of 40.7 kJ mol⁻¹. Buck provides another empirical temperature relation.
Agreement at the shared anchor is imposed. Differences away from it reveal sensitivity to model form, not which model is most accurate against experiments. The identical calling interface lets us make that comparison without changing the concentration-to-pressure conversion.
Python · section 8
# Anchor the constant model at the Antoine reference at 310 K.water_pure_at_310K = {    "vapor_pressure": float(water_antione.pure_vapor_pressure(310.0)),    "vapor_pressure_units": "Pa",}  # in Pascals (Pa)water_constant_strategy = par.gas.VaporPressureFactory().get_strategy(    strategy_type="constant", parameters=water_pure_at_310K)
# Setting parameters for the Clausius-Clapeyron equation for waterwater_clausius_clapeyron_parameters = {    "latent_heat": 40.7e3,  # specific latent heat J/mol    "latent_heat_units": "J/mol",    "temperature_initial": 310.0,  # Initial temperature in Kelvin    "temperature_initial_units": "K",    "pressure_initial": float(        water_antione.pure_vapor_pressure(310.0)    ),  # Initial pressure in Pascals    "pressure_initial_units": "Pa",}water_clausius_clapeyron_strategy = par.gas.VaporPressureFactory().get_strategy(    strategy_type="clausius_clapeyron",    parameters=water_clausius_clapeyron_parameters,)
# Using the Water Buck strategy, no additional parameters neededwater_buck_strategy = par.gas.VaporPressureFactory().get_strategy(    strategy_type="water_buck")
# Define a range of temperatures for which to calculate vapor pressurestemperatures = np.linspace(304.0, 333.0, 100)
# Calculate the pure vapor pressure at different temperatures using# various strategieswater_pure_constant = [    water_constant_strategy.pure_vapor_pressure(temp) for temp in temperatures]water_pure_antione = [    water_antione.pure_vapor_pressure(temp) for temp in temperatures]water_pure_clausius_clapeyron = [    water_clausius_clapeyron_strategy.pure_vapor_pressure(temp)    for temp in temperatures]water_pure_buck = [    water_buck_strategy.pure_vapor_pressure(temp) for temp in temperatures]
# Plotting the results using Matplotlibfig, ax = plt.subplots(figsize=(8, 6))ax.plot(temperatures, water_pure_constant, label="Constant", linestyle="-")ax.plot(temperatures, water_pure_antione, label="Antoine", linestyle="--")ax.plot(    temperatures,    water_pure_clausius_clapeyron,    label="Clausius-Clapeyron",    linestyle="-.",)ax.plot(temperatures, water_pure_buck, label="Buck", linestyle=":")ax.set_yscale("log")ax.set_xlabel("Temperature (K)")ax.set_ylabel("Pure Vapor Pressure (Pa)")ax.set_title("Comparison of Water Vapor Pressure Calculations")ax.legend(loc="lower right")plt.show()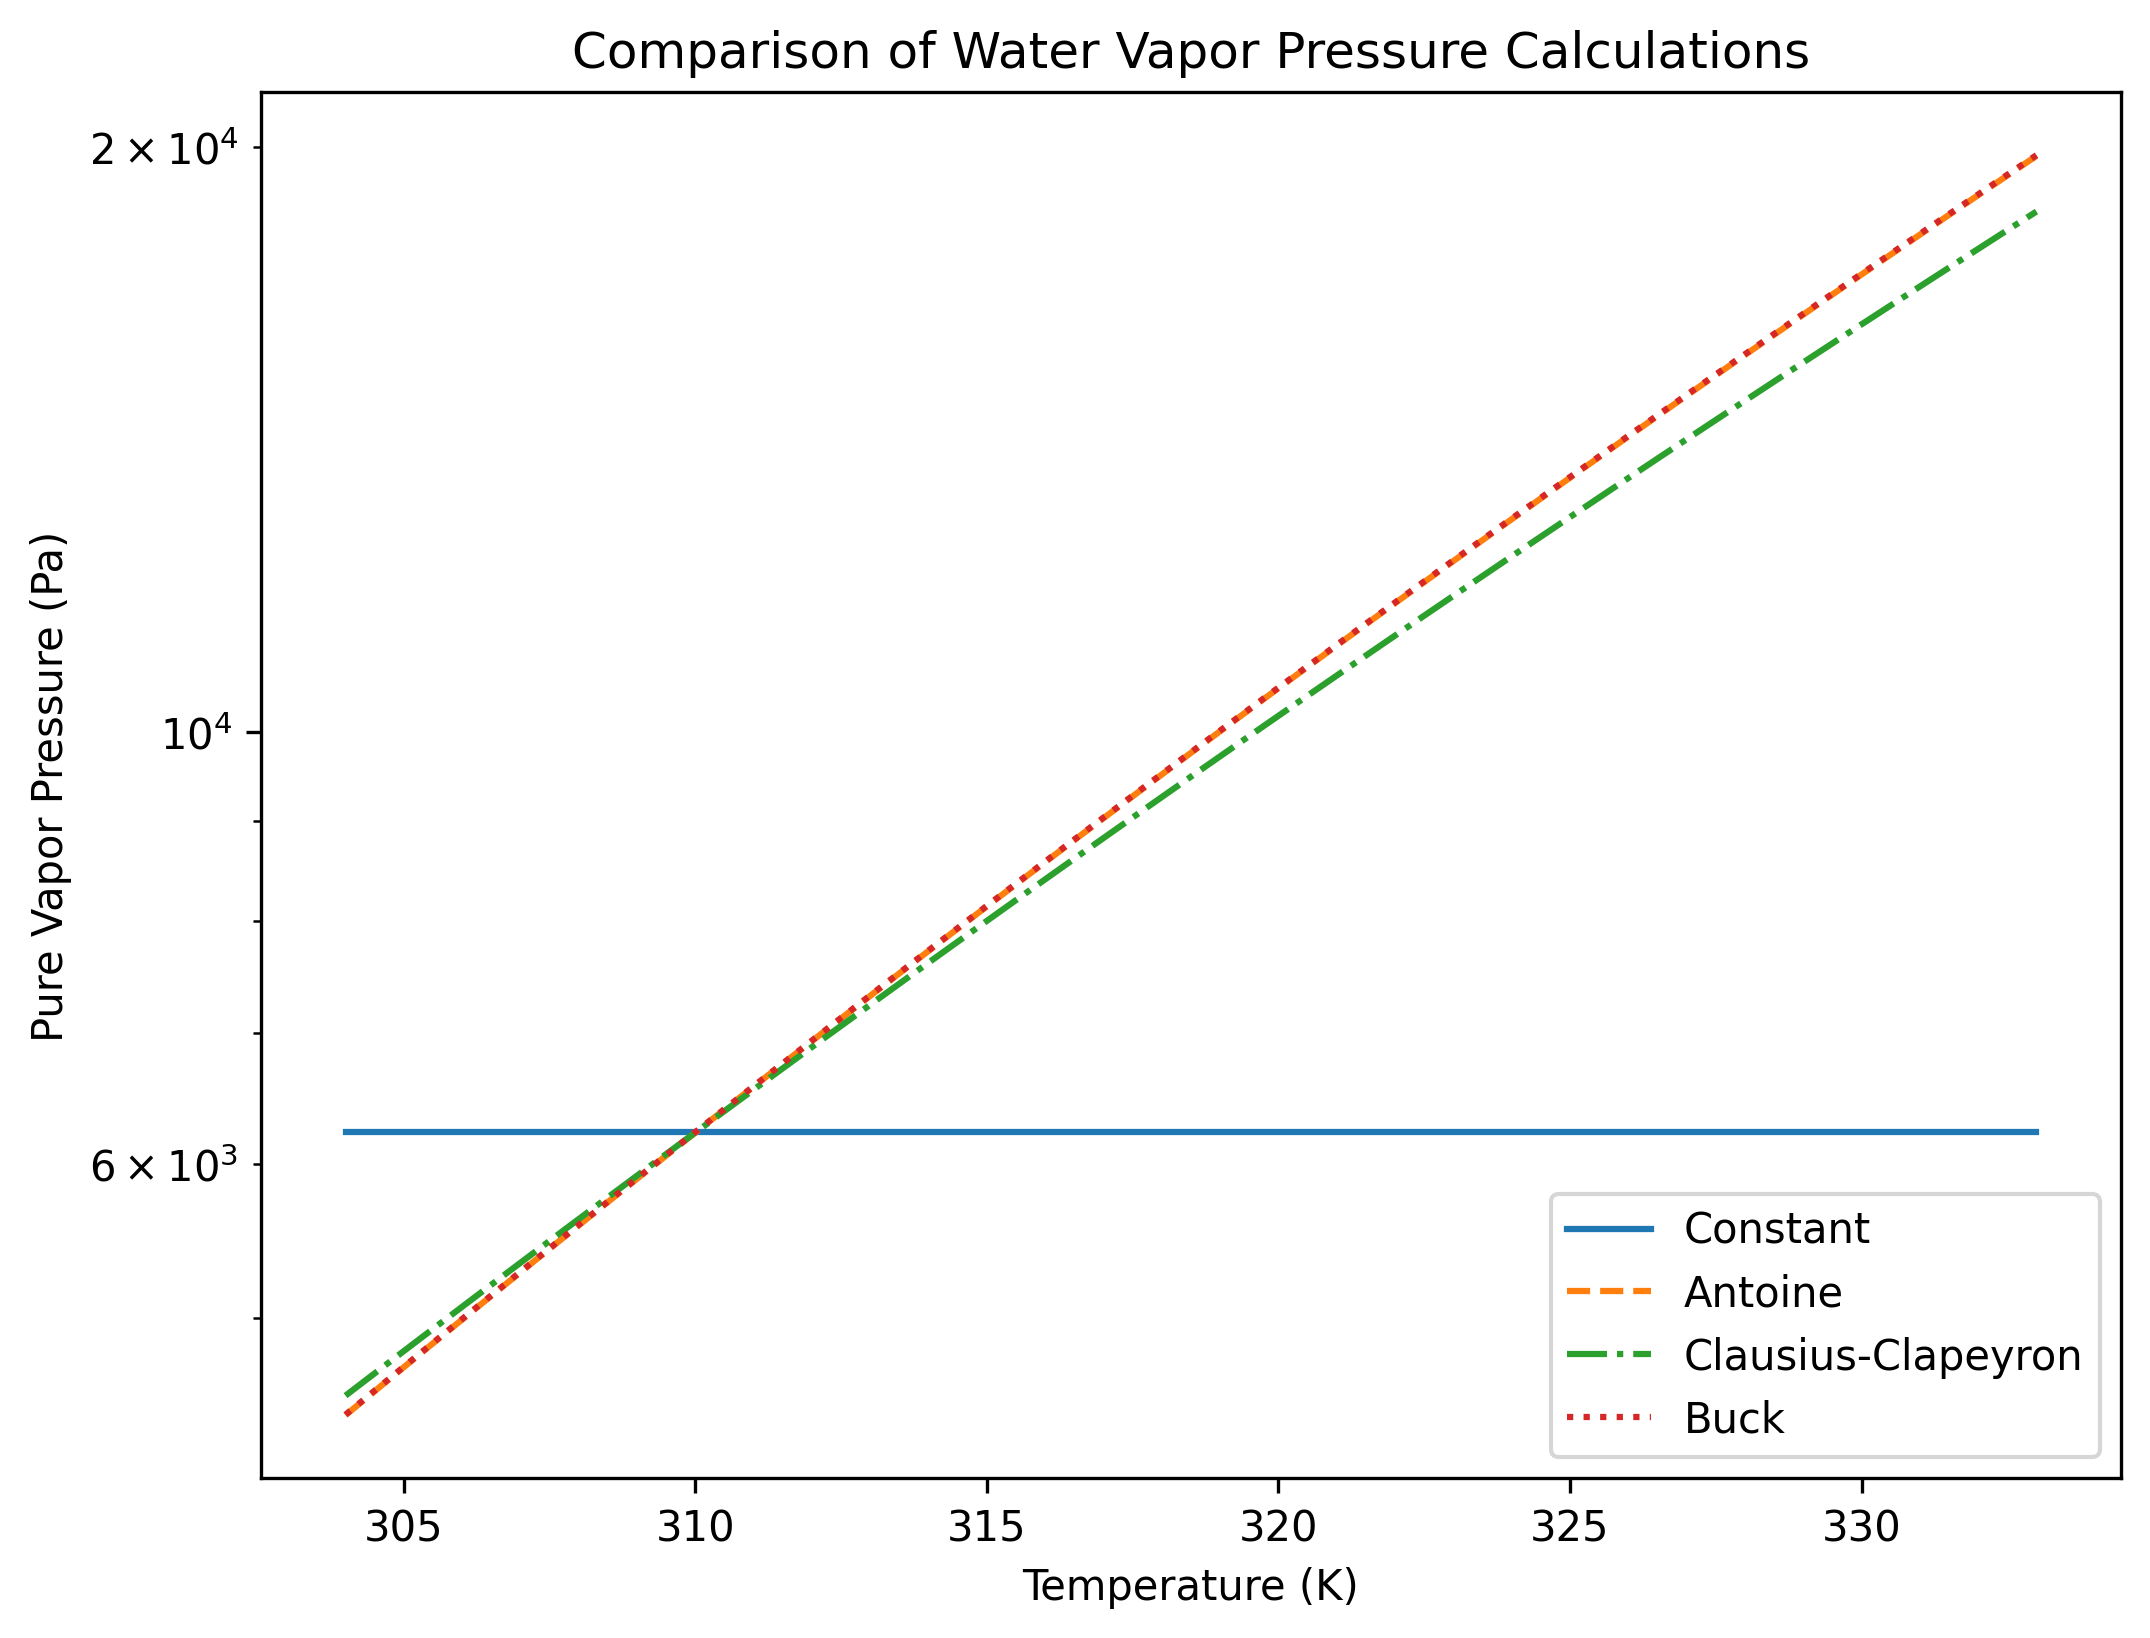
Carry the distinction into a research calculation
Section titled “Carry the distinction into a research calculation”Heating at fixed vapor mass concentration changes both actual partial pressure and the saturation reference. Their ratio, rather than either curve alone, answers whether the gas is undersaturated in this specified experiment. Coefficient conversion and reference-point agreement are numerical consistency checks; neither establishes accuracy outside the fitted temperature interval.
For an evaporation study, choose a sourced property model for the experimental range, propagate its uncertainty, and compare resulting mass-transfer rates with a particle calculation. Include surface activity and curvature, and allow vapor inventory to evolve if the reservoir is finite. Continue with gas storage or the initial condensation-rate example.
Explore this topic: Vapor pressure