

How strongly does curvature raise equilibrium vapor pressure?
Python · section 1
"""Tutorial on surface strategies and Kelvin effect calculations for particles."""'Tutorial on surface strategies and Kelvin effect calculations for particles.'How strongly does curvature raise equilibrium vapor pressure?
Section titled “How strongly does curvature raise equilibrium vapor pressure?”A small droplet needs a higher vapor pressure to remain in equilibrium than a flat liquid surface. How much of that increase comes from radius, and how much comes from the condensing species and the assumed surface composition? We compare glycerol, squalane, and glycerol in an illustrative mixed phase at 300 K. This is a Kelvin-factor calculation, not a droplet-growth simulation.
The dimensionless factor is
Read this alongside the activity comparison: activity and curvature are separate factors in equilibrium pressure. Material constants below are illustrative fixed inputs, without temperature dependence or a fitted surface-enrichment model.
Python · section 2
# In Colab uncomment the following command to install particula:# Install from the repository root: `python -m pip install -e ".[extra]"`import matplotlib.pyplot as pltimport numpy as npimport particula as parEstablish a pure-component reference
Section titled “Establish a pure-component reference”For one species, mole-, mass-, and volume-weighted surface tensions coincide.
Use named SI arguments to keep molar mass and surface tension distinct. The
printed Kelvin radius is a characteristic length, not the physical droplet
radius: at
Python · section 3
glycerol_molar_mass = 0.092093  # kg/molglycerol_density = 1261  # kg/m^3glycerol_surface_tension = 0.063  # N/m
# Create a surface strategyglycerol_surface_strategy = par.particles.SurfaceStrategyMolar(    surface_tension=glycerol_surface_tension,    density=glycerol_density,    molar_mass=glycerol_molar_mass,)
glycerol_kelvin_radius = float(    np.squeeze(        glycerol_surface_strategy.kelvin_radius(            molar_mass=glycerol_molar_mass,            mass_concentration=0.1,  # does not matter for a single species mixture            temperature=300,        )    ))
print(f"kelvin radius of glycerol {glycerol_kelvin_radius} m")
kelvin radius of glycerol 3.689152765296513e-09 mRead the radius dependence
Section titled “Read the radius dependence”The curve approaches one at large radius and rises rapidly as radius shrinks.
The dashed line marks
Python · section 4
radii = np.logspace(-10, -6, 100)
glycerol_kelvin_term = np.atleast_1d(    glycerol_surface_strategy.kelvin_term(        radius=radii,        molar_mass=glycerol_molar_mass,        mass_concentration=0.1,        temperature=300,    )).squeeze()
fig, ax = plt.subplots(figsize=(8, 6))ax.plot(radii, glycerol_kelvin_term)ax.plot(    np.array([glycerol_kelvin_radius, glycerol_kelvin_radius]),    np.array([glycerol_kelvin_term.min(), glycerol_kelvin_term.max()]),    color="red",    linestyle="--",)ax.set_yscale("log")ax.set_xscale("log")ax.set_title("Kelvin term of glycerol")ax.set_xlabel("radius (m)")ax.set_ylabel("Kelvin term")ax.legend(["Kelvin term", "Kelvin radius"])plt.show()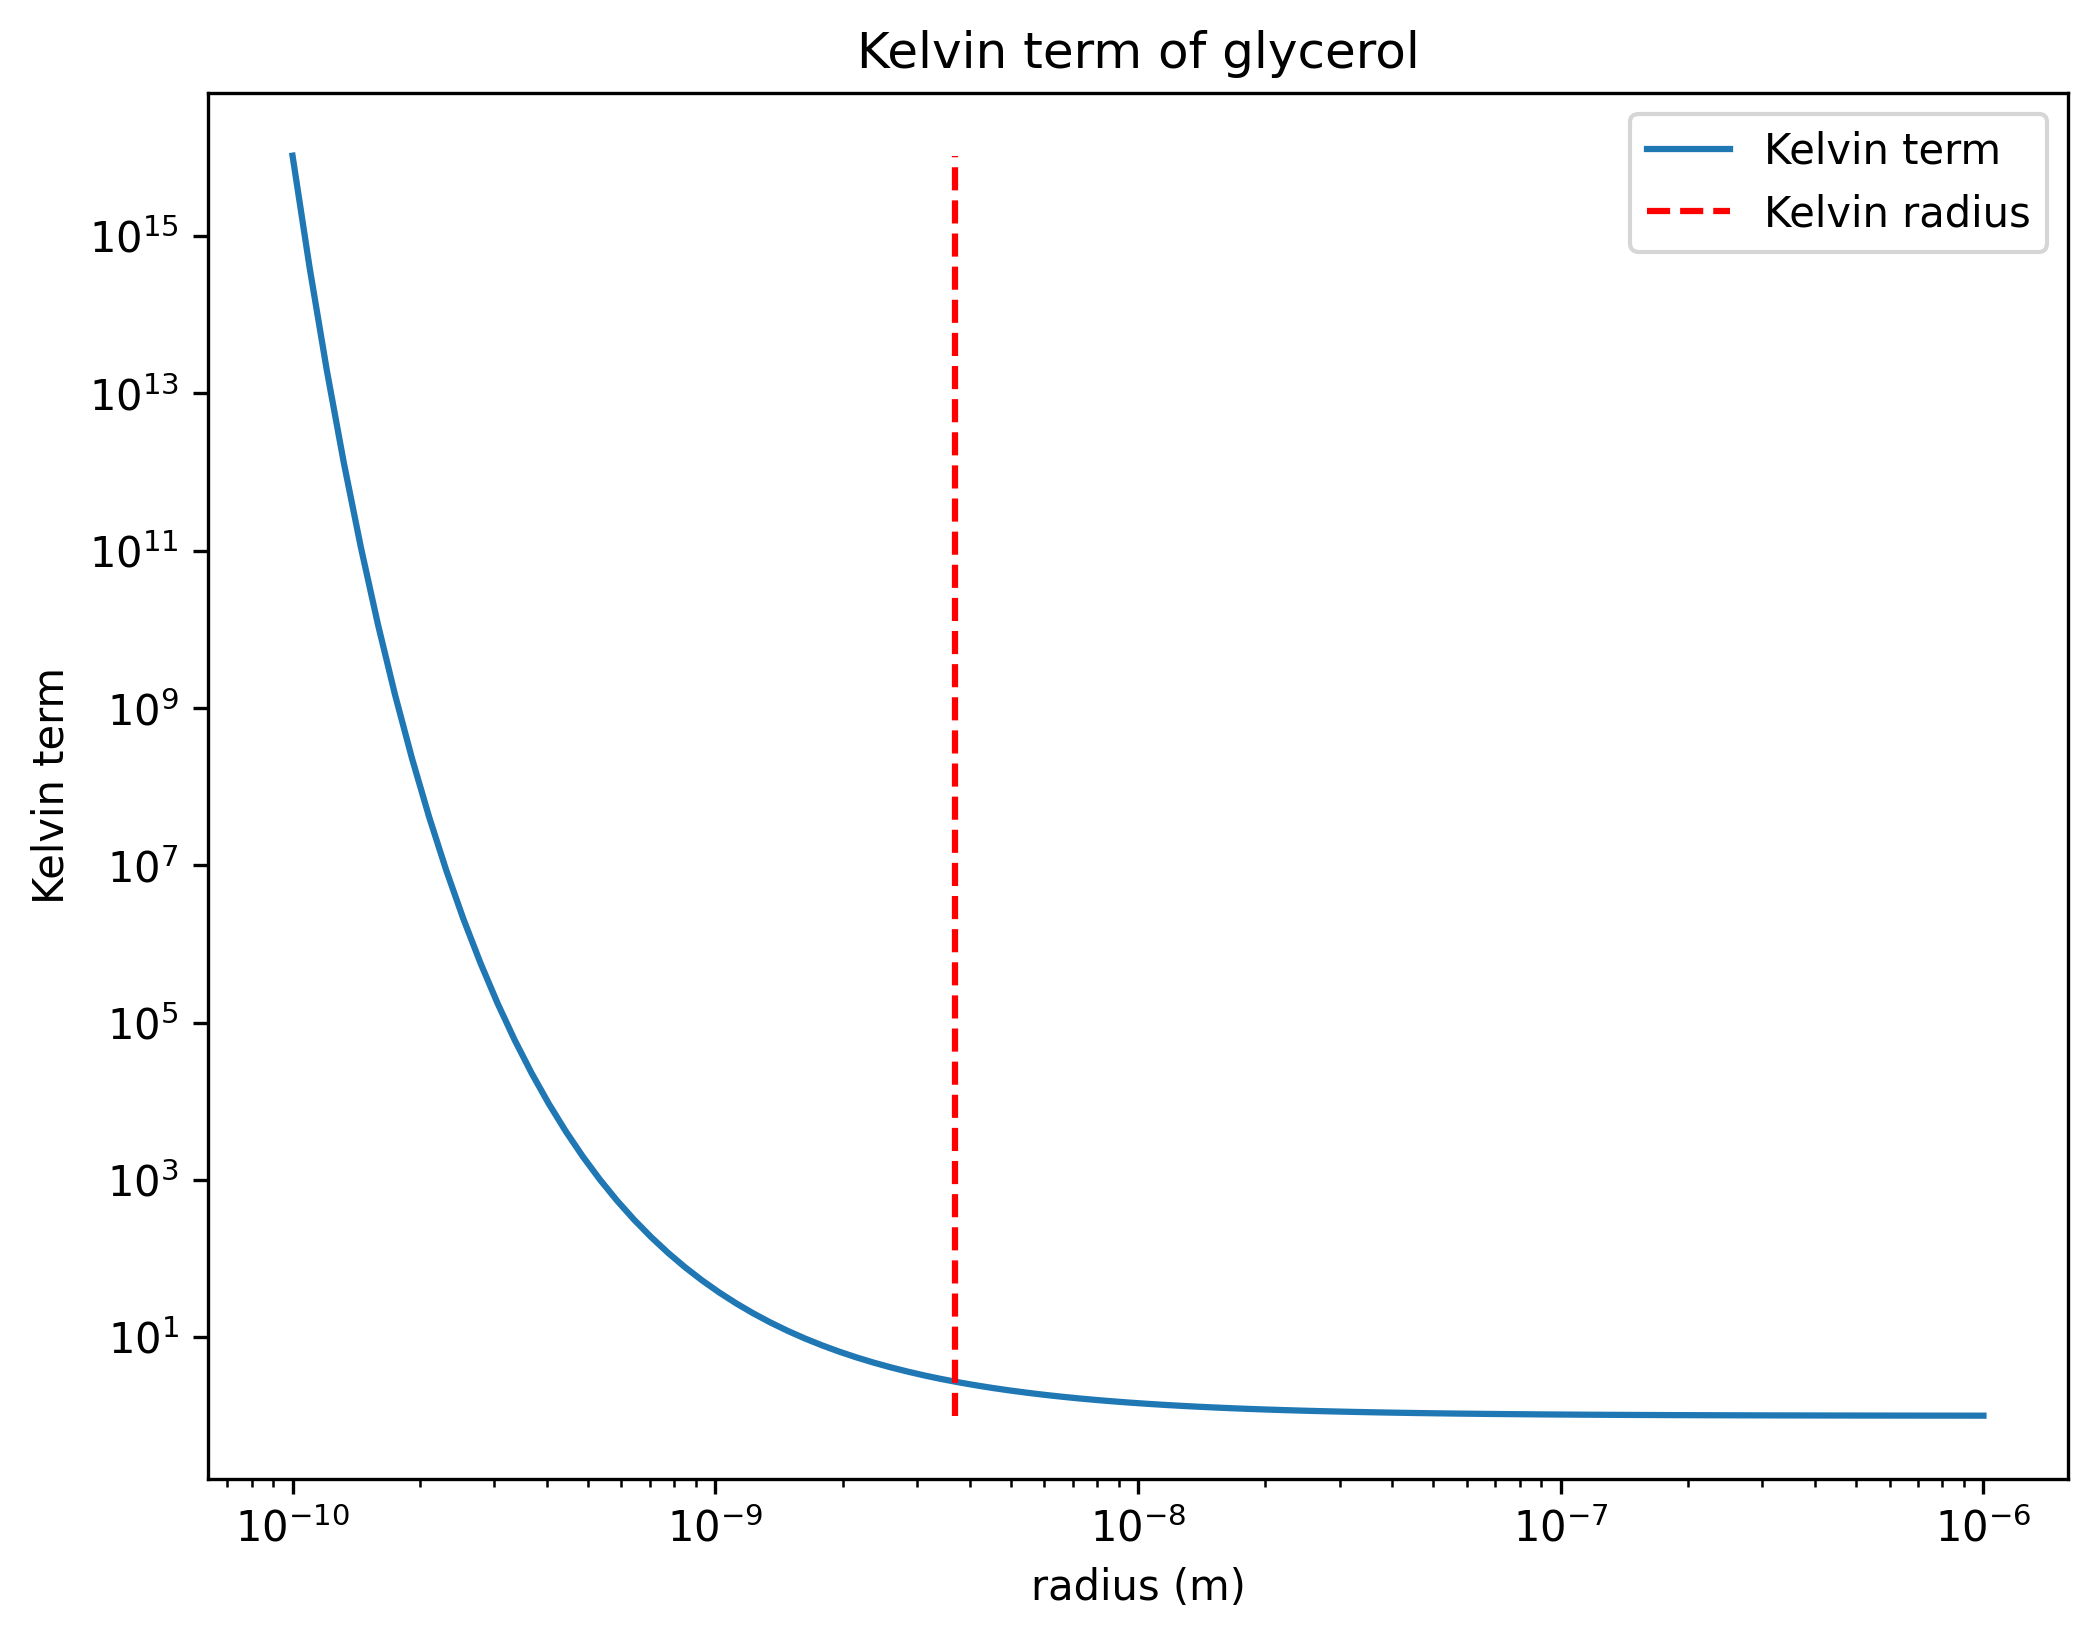
Separate surface tension from molecular volume
Section titled “Separate surface tension from molecular volume”The builder converts 0.81 g/cm³ to 810 kg/m³ and 28 mN/m to 0.028 N/m for
squalane. Its surface tension is lower than glycerol’s, but its
Python · section 5
squalane_surface = (    par.particles.SurfaceStrategyMassBuilder()    .set_density(0.81, density_units="g/cm^3")  # call with parameter name    .set_surface_tension(28, "mN/m")  # call without parameter name    .build())
# create plotsqualane_kelvin_radius = float(    np.squeeze(        squalane_surface.kelvin_radius(            molar_mass=0.422, mass_concentration=0.1, temperature=300        )    ))squalane_kelvin_term = np.atleast_1d(    squalane_surface.kelvin_term(        radius=radii,        molar_mass=0.422,        mass_concentration=0.1,        temperature=300,    )).squeeze()
fig, ax = plt.subplots(figsize=(8, 6))ax.plot(radii, squalane_kelvin_term)ax.plot(    np.array([squalane_kelvin_radius, squalane_kelvin_radius]),    np.array([squalane_kelvin_term.min(), squalane_kelvin_term.max()]),    color="red",    linestyle="--",)ax.set_yscale("log")ax.set_xscale("log")ax.set_title("Kelvin term of squalane")ax.set_xlabel("radius (m)")ax.set_ylabel("Kelvin term")ax.legend(["Kelvin term", "Kelvin radius"])plt.show()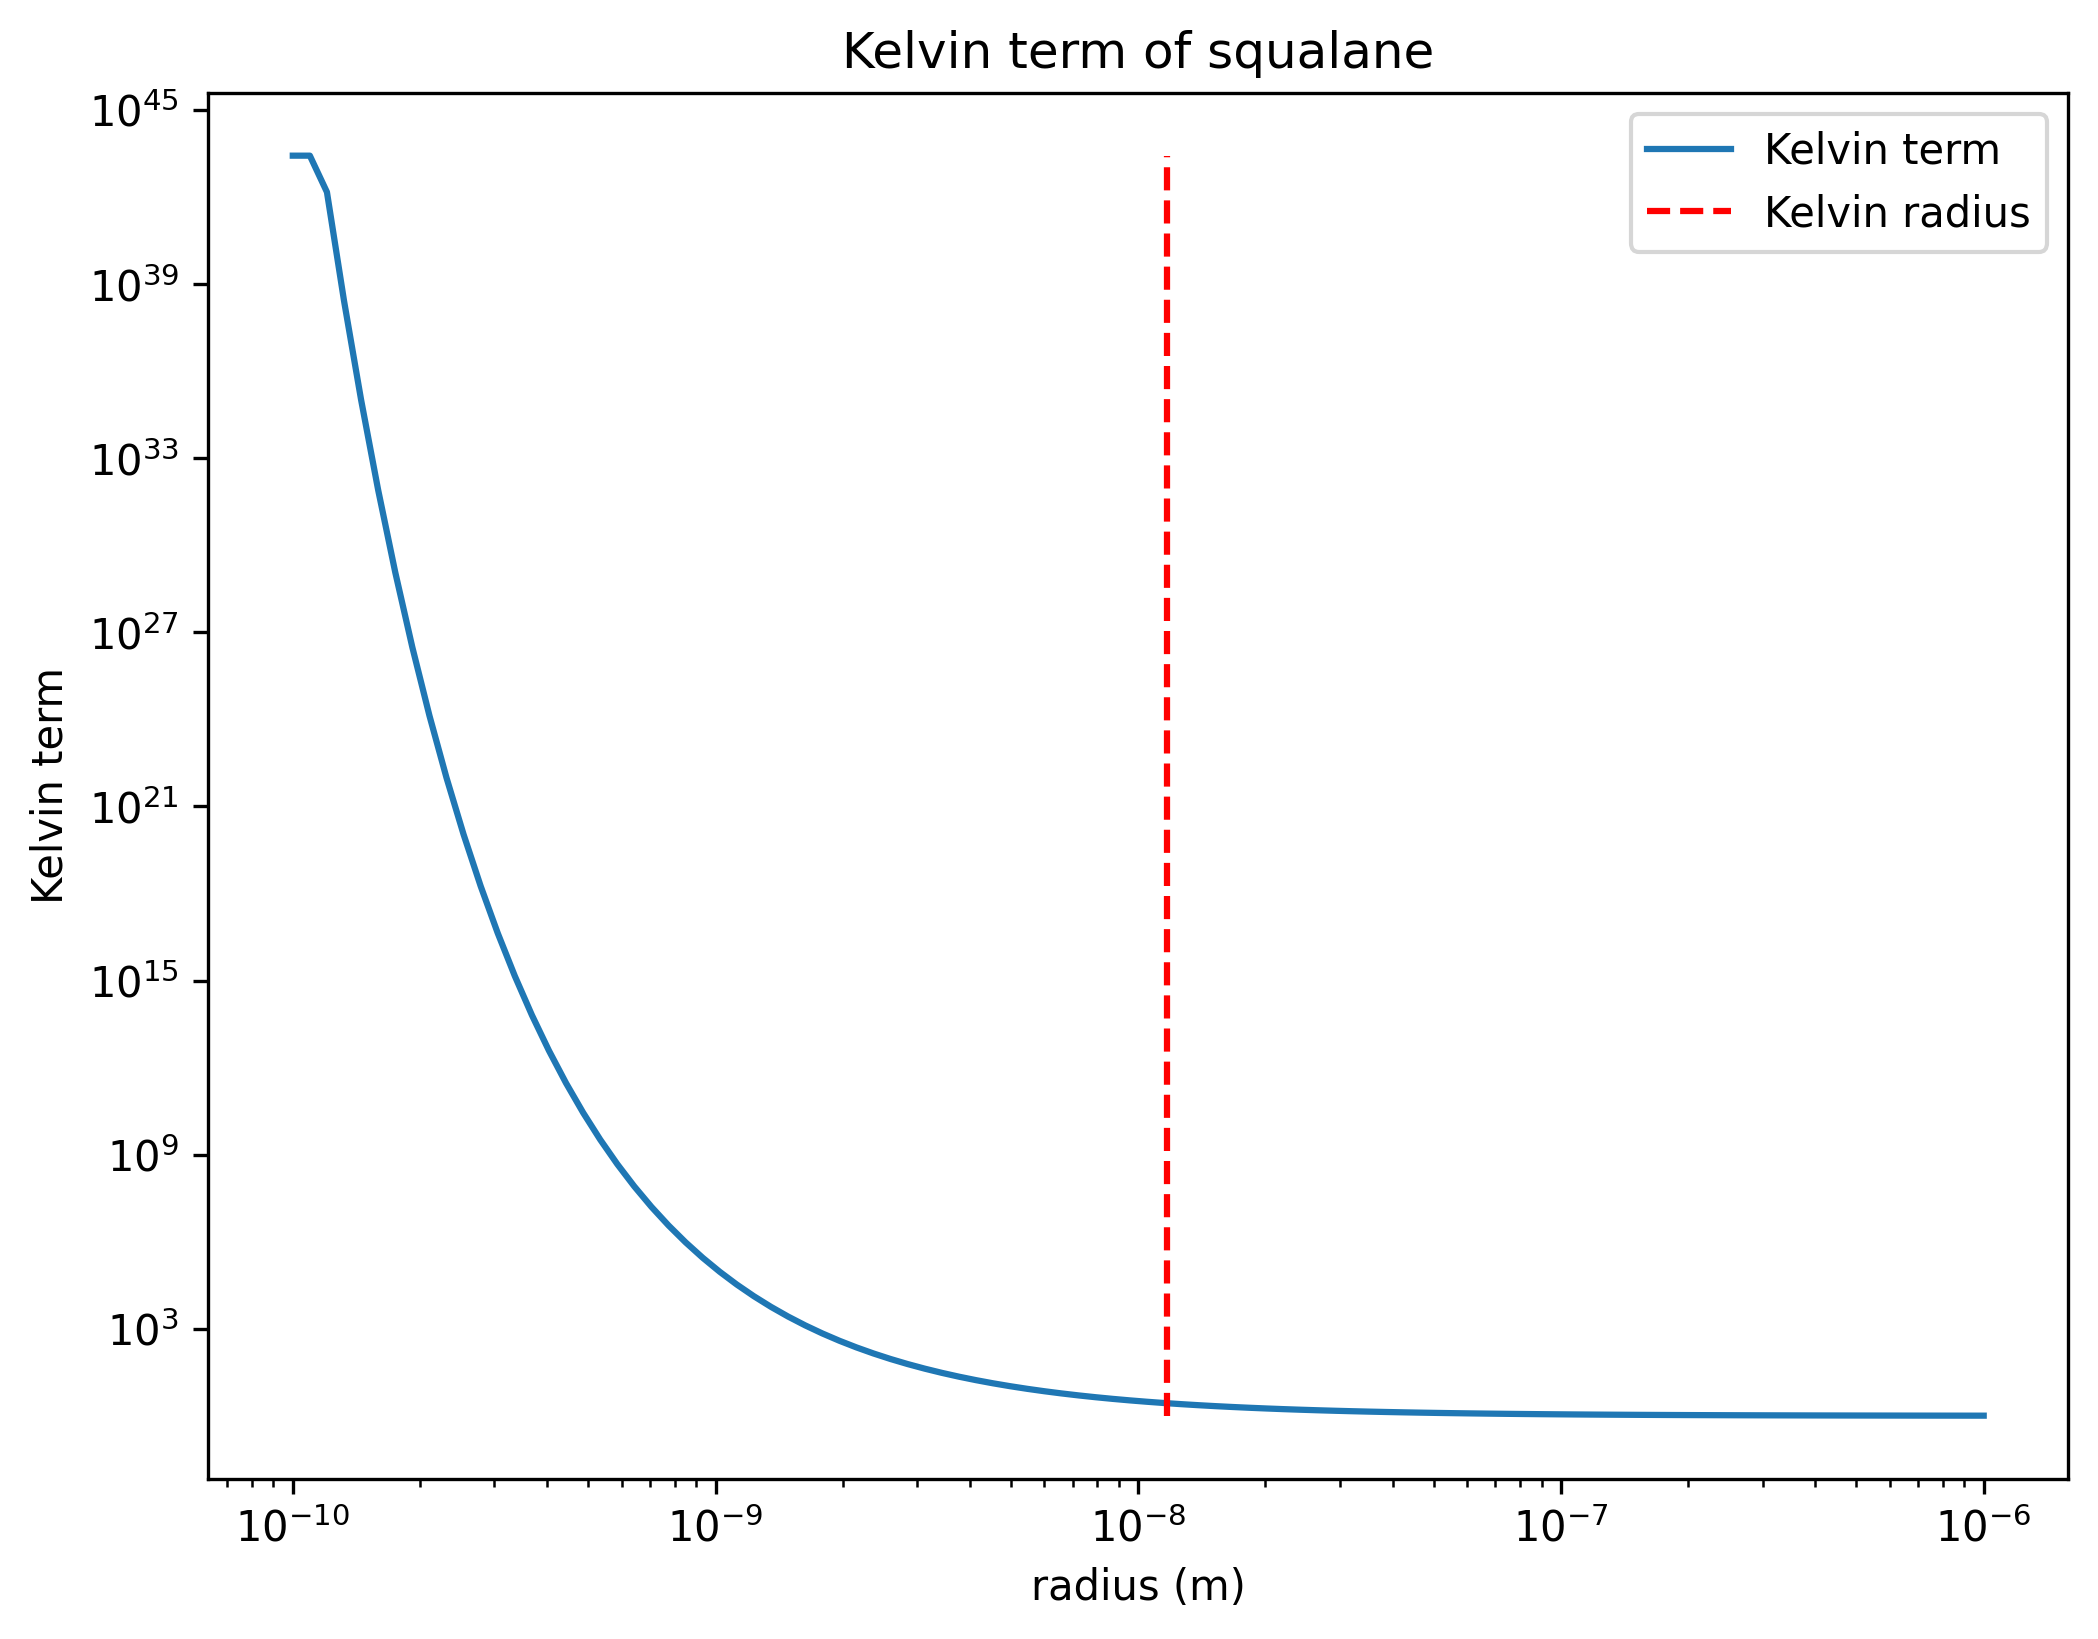
Put two species in one assumed phase
Section titled “Put two species in one assumed phase”The factory exposes the volume-weighted builder. Assign both species to phase zero explicitly: without a phase assignment, the strategy retains separate species surface tensions. Equal mass contributions of 0.1 kg/m³ give unequal volume fractions because the densities differ.
This is an imposed homogeneous phase, not a prediction that glycerol and squalane are miscible. Volume averaging sets one surface tension for that phase. Each species still has its own molar mass and density. Calculate both species lanes, then select glycerol’s lane for comparison with pure glycerol. That comparison isolates the chosen surface-tension mixing rule. The pure squalane curve also changes the condensing species and is labeled separately.
Python · section 6
parameters = {  # glycerol, squalane    "density": np.array([1261, 810]),  # kg/m^3    "density_units": "kg/m^3",    "surface_tension": np.array([0.063, 0.028]),  # N/m    "surface_tension_units": "N/m",}
mixture_surface = (    par.particles.SurfaceFactory()    .get_builders()["volume"]    .set_parameters(parameters)    .set_phase_index(np.array([0, 0]))    .build())
mixture_kelvin_radius = mixture_surface.kelvin_radius(    molar_mass=np.array([0.092093, 0.422]),    mass_concentration=np.array([0.1, 0.1]),    temperature=300,)mixture_kelvin_radius = float(np.asarray(mixture_kelvin_radius).reshape(-1)[0])print(f"kelvin radius of glycerol in mixture {mixture_kelvin_radius} m")
mixture_kelvin_term = np.atleast_1d(    mixture_surface.kelvin_term(        radius=radii,        molar_mass=np.array([0.092093, 0.422]),        mass_concentration=np.array([0.1, 0.1]),        temperature=300,    ))[:, 0]
# Independently check SI conversion and the chosen phase-average formula.from particula.util.constants import GAS_CONSTANT
volume_contributions = np.array([0.1, 0.1]) / parameters["density"]volume_fractions = volume_contributions / volume_contributions.sum()expected_surface_tension = np.dot(    volume_fractions, parameters["surface_tension"])np.testing.assert_allclose(    glycerol_kelvin_radius,    2    * glycerol_surface_tension    * glycerol_molar_mass    / (GAS_CONSTANT * 300 * glycerol_density),)np.testing.assert_allclose(    squalane_kelvin_radius, 2 * 0.028 * 0.422 / (GAS_CONSTANT * 300 * 810))np.testing.assert_allclose(    mixture_kelvin_radius,    2    * expected_surface_tension    * glycerol_molar_mass    / (GAS_CONSTANT * 300 * glycerol_density),)np.testing.assert_allclose(    mixture_kelvin_term, np.exp(mixture_kelvin_radius / radii))
fig, ax = plt.subplots(figsize=(8, 6))ax.plot(radii, mixture_kelvin_term, label="Glycerol in mixed phase")ax.plot(    np.array([mixture_kelvin_radius, mixture_kelvin_radius]),    np.array([mixture_kelvin_term.min(), mixture_kelvin_term.max()]),    color="red",    linestyle="--",)ax.plot(radii, glycerol_kelvin_term, label="Pure glycerol")ax.plot(    np.array([glycerol_kelvin_radius, glycerol_kelvin_radius]),    np.array([glycerol_kelvin_term.min(), glycerol_kelvin_term.max()]),    color="red",    linestyle="--",)ax.plot(radii, squalane_kelvin_term, label="Pure squalane")ax.plot(    np.array([squalane_kelvin_radius, squalane_kelvin_radius]),    np.array([squalane_kelvin_term.min(), squalane_kelvin_term.max()]),    color="red",    linestyle="--",)ax.set_yscale("log")ax.set_xscale("log")ax.set_title("Kelvin term of mixture")ax.set_xlabel("radius (m)")ax.set_ylabel("Kelvin term")ax.legend()plt.show()
kelvin radius of glycerol in mixture 2.4412259352522773e-09 m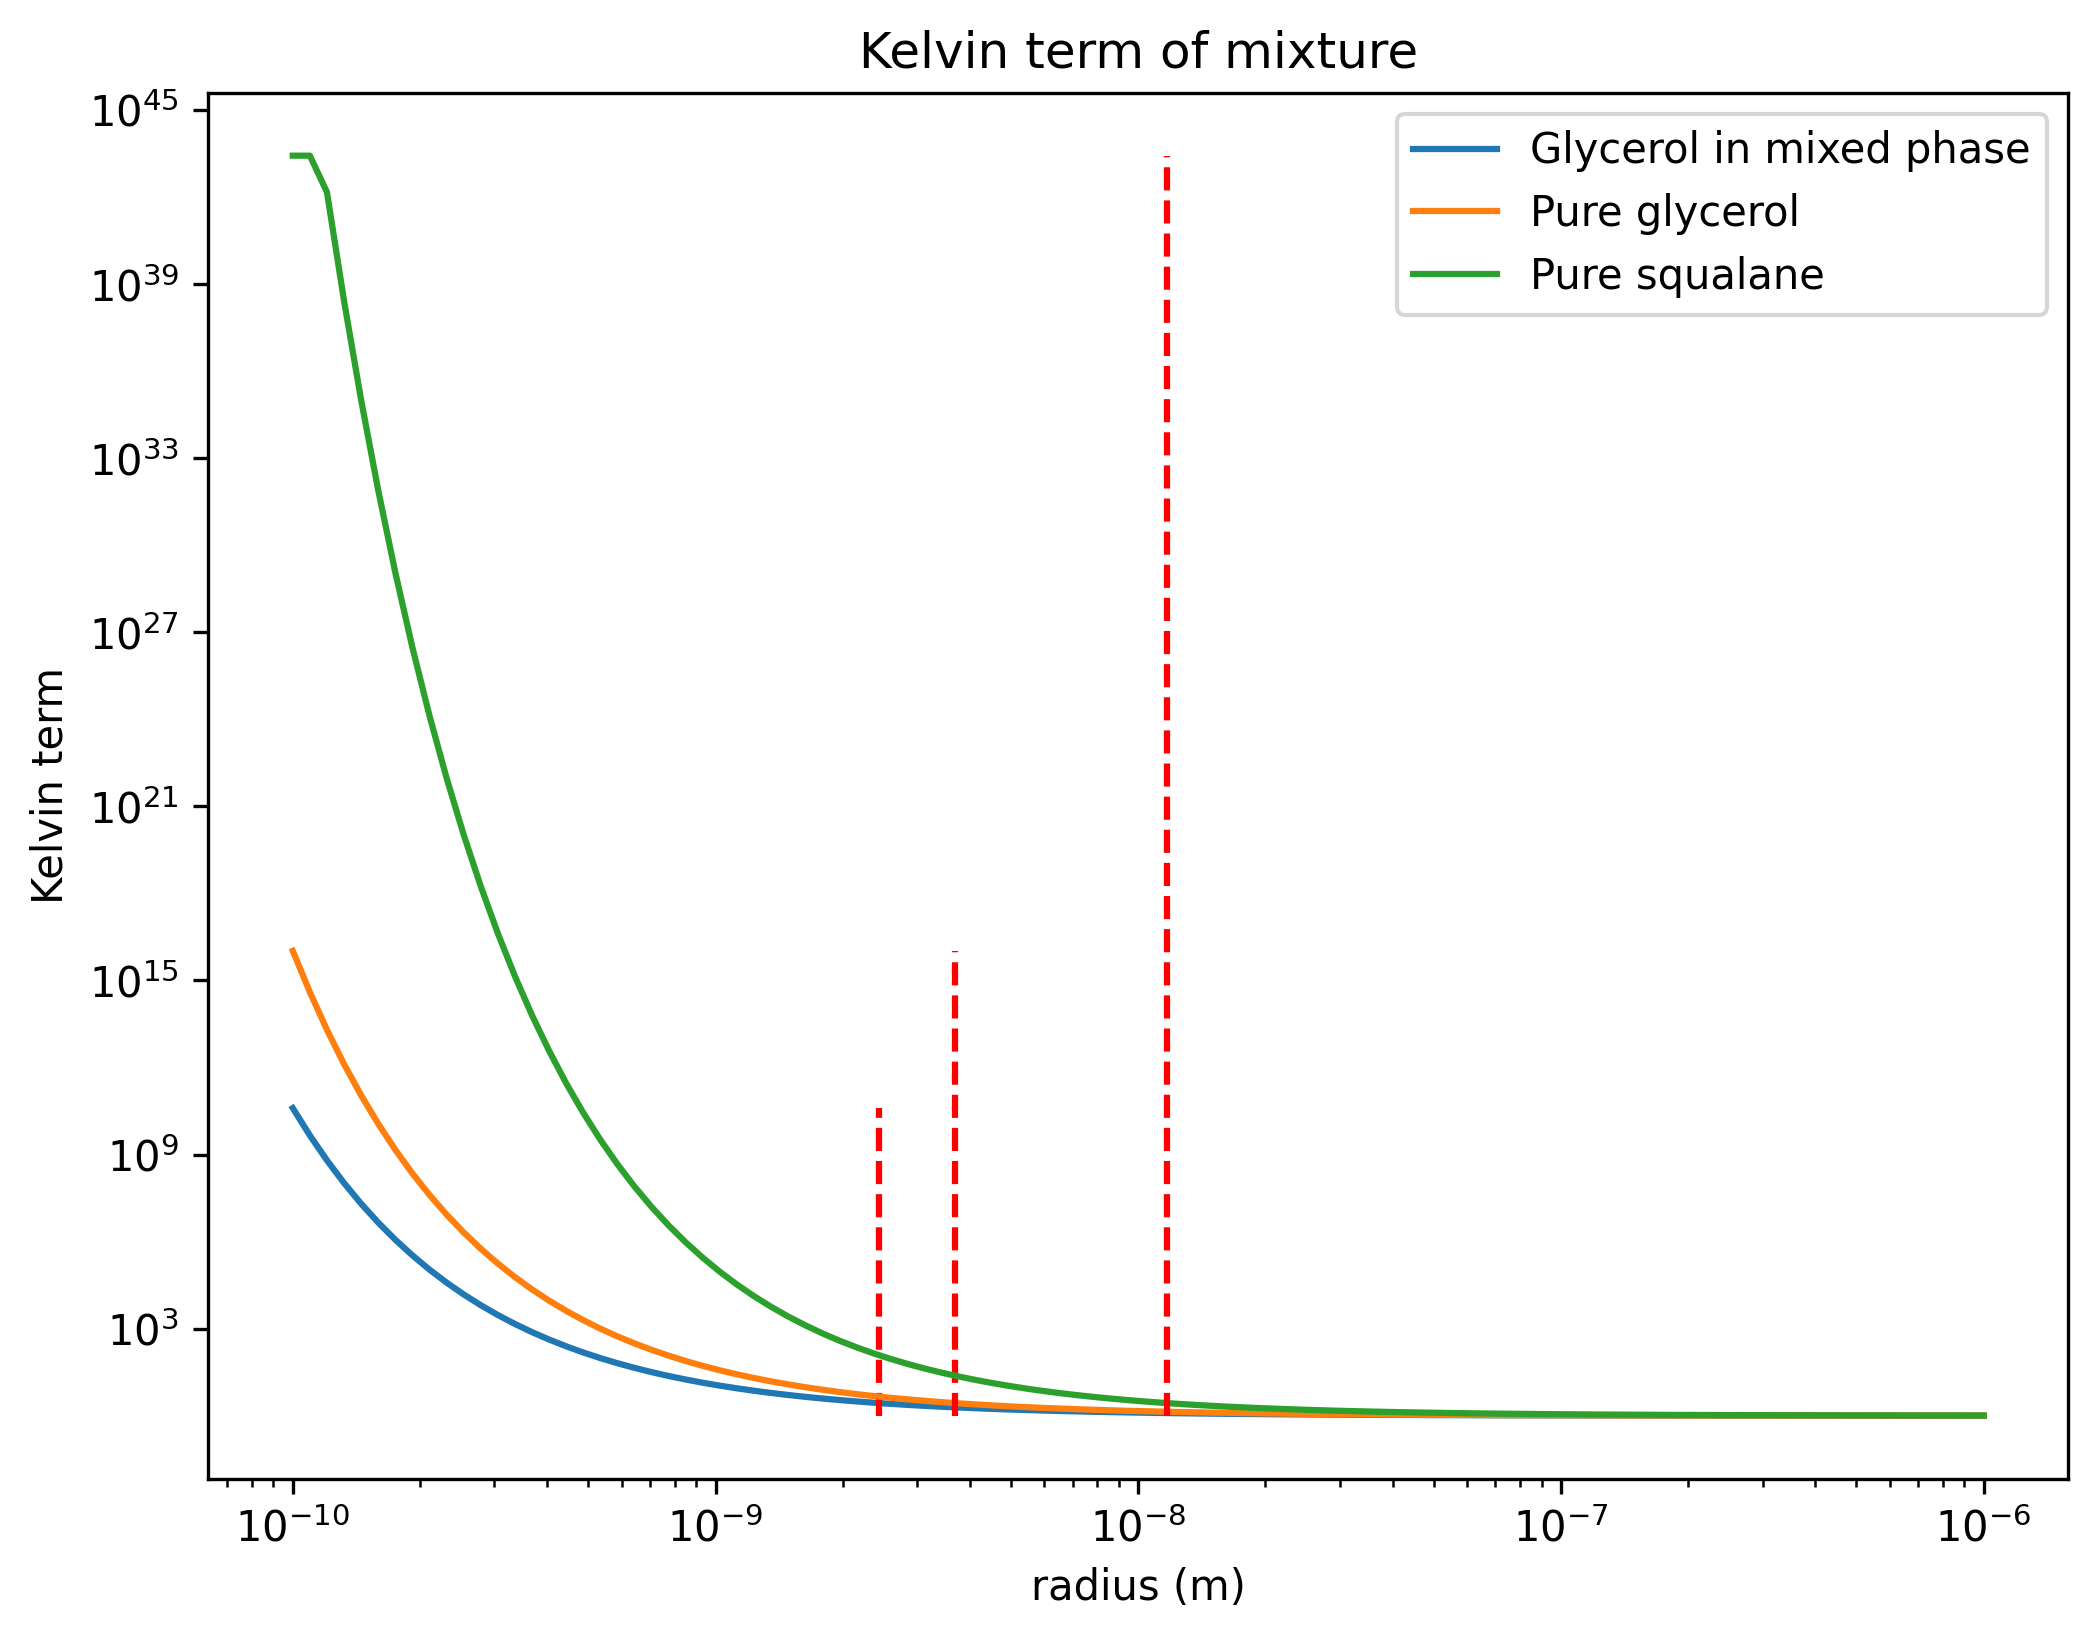
What the comparison tells us
Section titled “What the comparison tells us”For these inputs, adding the lower-surface-tension component reduces the Kelvin factor for glycerol relative to pure glycerol. Pure squalane has the larger factor despite its lower surface tension, because its molar volume is larger. Thus surface tension alone cannot rank curvature effects across species. The equation checks verify parameter conversion and the imposed averaging rule; they do not establish that the mixture is physically homogeneous.
For a research extension, vary the squalane mass fraction and compare glycerol’s
Explore this topic: Surface and curvature